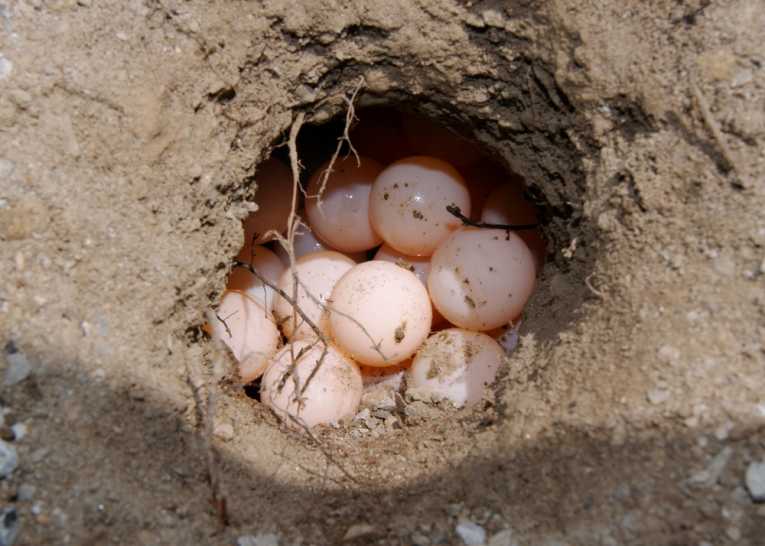
Leatherback turtles have to dig through 80cm of sand after hatching on the beach. Hot dry conditions associated with global warming are making this increasingly more difficult. Olive Ridley turtles and green turtles also suffer from dry season conditions during their incubation when they emerge, but leatherbacks here prove that at least one turtle species is in great danger.
Pilar Santidrián Tomillo and his co-authors of Drexel University Philadelphia, US, The Leatherback Turtle Trust, Princeton University, Indiana-Purdue University and NOAA combine to project a model of trends in the breeding success of the Leatherback. They publish in PLoS ONE.
While humidity and cool temperatures prevent dessication in a La Nina type year, the authors' climate projections predict increasing mortalities as El Nino causes warming and drying. This rapid decline could be in the area of 50-60% decrease in the tiny animals' survival.
The stability of a nest is of prime importance, In the terrible extinctions of the Cretaceous, crocodiles and turtles are thought to have had relatively stable temperatures and humidities in the nest site substrates. Now we have El Nino periods when warm surface temperatures predominate in the Pacific and La Nina periods, which are cool and variable in length and strength.
Leatherbacks are extremely vulnerable, left with only one major nesting site in Playa Grande in Costa Rica. The trends shown by this study show a decreasing hatching success from 0.45 to a mere 0.17 and emergence rate (down from 0.79 to 0.26).
It is to be hoped that we can conserve with a will here, given the data provided and act on the beaches themselves to preserve the physical environment and conserve all turtle species. We just can't afford to lose wildlife like these valuable resources of an evolutionary past and an ecological future.

Credit: PLoS ONE
Above Graphs: Hatching success and emergence rate projections of leatherback nests in 100 years of climate change. Projections are based on (a,b) each of the 17 bias-corrected CMIP3 models (grey lines) and the ensemble mean (black line) and (c,d) 5 of the bias-corrected CMIP3 models that are skilful at resolving present-day ENSO climate variability (coloured lines) and their ensemble mean (black line). Time-series projections are presented as 10-year moving averages


