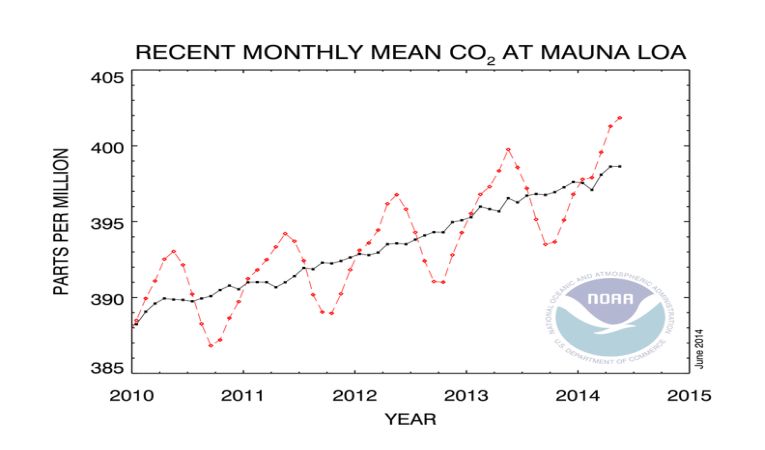
When we measure the carbon dioxide concentration in the atmosphere, it is often useful to compare ground level parts per million in dry air with those taken at Mauna Loa in Hawaii. This observatory is situated at an elevation of 3400m or 11,155 feet. A mole fraction of 0.0004 CO 2 would be shown, for example in parts per million, as 400ppm. This is the level of pollution we are trying to avoid, as further fossil fuel emissions threaten to break through that concentration and send the levels sky-high.
Four 4 years, the rising levels of the greenhouse gas are shown steadily rising, as indeed they have done since measurements began in March, 1958. There are some years, early in the sequence, when falls looked promising, but the rise has really been inexorable. The lowest and highest figures were:
in the 1960s 0.28ppm and 1.31ppm,
in the 1970s, 0.78ppm and 2.10ppm, and,
in the 1980s, 0.96ppm.and 2.29ppm.
Since then, there have been some falls but in the last decade, the low has been only 1.56ppm (2004) and the high, 2.66ppm (2013).
Down at sea-level, the seasonal variation is much larger than that at the top of the volcano. Samples are taken at Cape Kumukahi nearby, so the unique and isolated nature of the Pacific islands is recorded at two comparative levels, with a time lag of a few weeks before the lower changes are noted at the higher site.
NOAA released their latest figures from Mauna Loa as - Trends in Atmospheric Carbon Dioxide. They read: May 2014 - 401.85ppm of CO2!


