Things have looked decidedly dodgy for the Arctic polar ice-cap for a number of years now - especially since the record-breaking melt-out of 2007, when summer sea-ice levels plummeted to 4.1 million square km. That was 40% below the average for the previous three decades. But as this summer's melt season hits its peak in the northern hemisphere, it looks like 2011 is in a head-to-head race to exceed that loss.
As of the 20th of July, the sea-ice extent (covering parts of the Arctic with at least 15% ice) had hit 7.1m sq km, a whisker below the ice-levels seen at the same time of year, in the record-breaking 2007. Sea-ice levels in the North Pole do naturally ebb and flow with the seasons, reaching their peak in March, as winter ends, and falling to a low each year at the end of summer, in September. What scientists track is the changes between different years - and changes in the long-term average.

Figure 1. Arctic sea ice extent on July 17, 2011 was 7.56 million square kilometers (2.92 million square miles). The orange line shows the 1979 to 2000 median extent for that day. The black cross indicates the geographic North Pole.
Credit: National Snow and Ice Data Center
Methane menace
Sea-ice levels above the Arctic Circle matter for many reasons. The bright white stretches of ice act as a big reflector, sending much of the sun's energy back into outer space. As the ice cap shrinks, the dark sea that replaces it sucks up the sun's energy instead - so making a warming Arctic even warmer - a positive feedback.
And the Arctic holds onto some of the more dangerous climate tipping points on the planet - methane hydrates lying on its sea-floor, and methane locked into the frozen soils of the permafrost of the tundra. If the Arctic got warm enough to cause those gases to be released, another pair of massive positive feedbacks could be unleashed - as methane is twenty times more powerful a greenhouse gas than CO2.
Melt season longer, warmer
The latest report on the melt for this year, from the Colorado-based National Snow and Ice Data Center, puts the quickening pace down to a warmer temperatures across much of the Arctic Sea. The North Pole, East Siberian and Laptev Seas all had temperatures between 5 and 14 degrees F warmer than usual for July. In addition, the melt season, which starts with ponds forming on the surface of the ice, got going several weeks earlier across much of the region.

Figure 2. The graph above shows daily Arctic sea ice extent as of July 17, 2011, along with daily ice extents for previous low-ice-extent years. Light blue indicates 2011, dashed green shows 2007, dark blue shows 2010, and dark gray shows the 1979 to 2000 average. The gray area around the average line shows the two standard deviation range of the data.
Credit: National Snow and Ice Data Center
Polar scientists have also just published their prediction of where the minimum sea-ice area will be in September. The forecast from these experts is that 2011 will be low, but not the lowest - coming just short of besting 2007's low-point. What matters between now and then is how the weather pans out, as the north's endless summer days come to an end.
The vanishing extra dimension
But whether the expert forecast of sea-ice area is right or not, there is another worrying dimension - the surface visible to satellites is only part of the sea-ice story. Ice thickness varies considerably, and depends on how old fragments of ice are. And it is that thickness which is key to deciding how close we are to an ice-free summer in the Arctic.
Up until recently, satellites have been able to measure only the visible ice-area. But scientists at the Polar Science Center at the University of Washington have developed a model to fill in that missing third dimension. And their numbers, for last month, are even more scary than the sea-ice area figures - June showed the lowest volume of sea-ice in their 30-year old record.

Arctic sea ice volume anomaly from PIOMAS updated once a month. Daily Sea Ice volume anomalies for each day are computed relative to the 1979 to 2010 average for that day of the year. The trend for the period 1979- present is shown in blue. Shaded areas show one and two standard deviations from the trend. Error bars indicate the uncertainty of the monthly anomaly plotted once per year.
Credit: Credit: National Snow and Ice Data Center
All losing from ice loss
The numbers for this year are regularly coming out at some 2000 cubic km less than the previous low of 2007. So even if the 2011 fails to pip 2007 to the post when it come to area, it seems clear that we are in new territory when it comes to the amount of sea-ice left. The trend in the numbers is obviously downwards - and appears to be gathering pace.
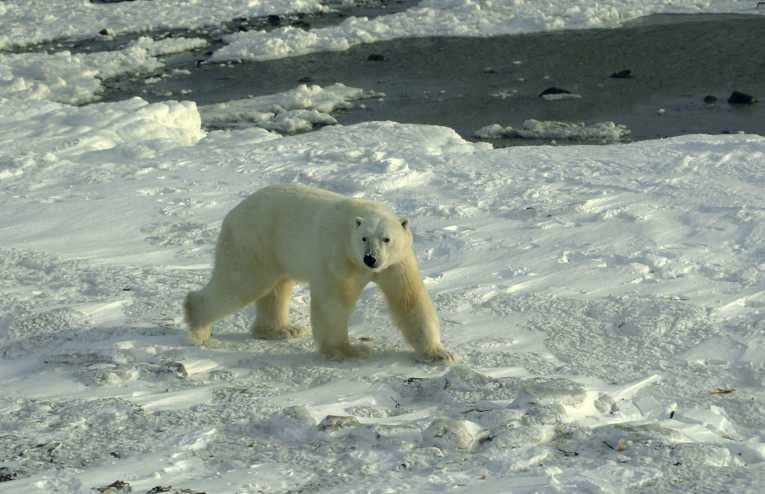
All of this adds up to bad news for the planet; and for the polar bear. A study presented yesterday at the International Bear Association (IBA) Conference in Ottawa, Canada, has confirmed that shrinking ice levels are making it harder for polar bears. As the ice recedes, they have to swim further when looking for food or shelter. That is putting their cubs at risk, with higher instances of cubs drowning on long swims. Ultimately, in this race to the bottom, no-one appears to be winning.


