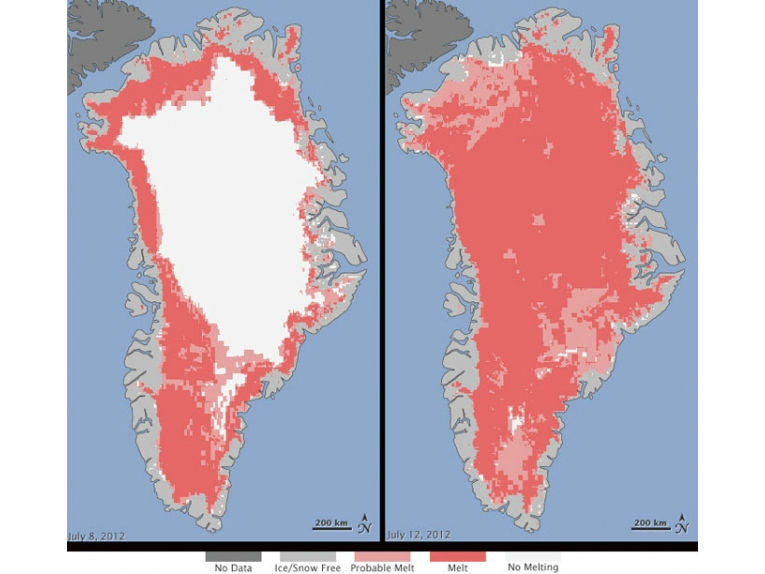
More of Greenland's surface ice sheet has melted this month than since records began 30 years ago.
A massive 97% of the surface ice sheetmelted in July and was so large that scientists could scarcely believe it. Much of the meltwater freezes again later, but the findings still give cause for concern.
But measurements from three National Aeronautics and Space Administration (NASA) satellites confirmed almost every part of the ice sheet, which is two miles deep in the middle and much thinner at the edge, suffered some melting.
Every summer, around half Greenland's surface ice sheet melts. On higher ground, much of the meltwater freezes again. In coastal areas, some meltwater goes into the ice sheet and the remainder finds its way into the ocean.
The satellite data, which has been analysed by scientists, confirms that around 97% of the surface of the ice sheet melted during the middle of July.
NASA Cryosphere Program Manager, Tom Wagner, says, "The Greenland ice sheet is a vast area with a varied history of change. The event, combined with other natural but uncommon phenomena, such as the large calving event last week on Petermann Glacier, are part of a complex story.
"Satellite observations are helping us understand how events like these may relate to one another as well as to the broader climate system."
It is too early for scientists to say if the record ice melt will increase the final summer ice loss and cause sea levels to rise.
Son Nghiem from the NASA Jet Propulsion Laboratory in California first noticed the problem while looking at data from the Oceansat-2 satellite, which belongs to the Indian Space Research Organisation.
When he discovered the extent of the surface melting he was so amazed that he thought the findings might be caused by faulty data.
So he called NASA's Dorothy Hall at the Goddard Space Flight Centre in Maryland, who analyses Greenland's surface temperature with a Moderate-resolution Imaging Spectrodiometer on board NASA's Aqua and Terra satellites. Dorothy confirmed the temperatures were exceptionally high and that there had been a large surface ice melt.
Climatologist Thomas Mote, from the University of Georgia and Marco Tedesco, from New York's City University also confirmed the ice melt using passive microwave satellite data from the Special Sensor Microwave Imager/Sounder, which the US Air Force uses to predict weather patterns.
Melt map reveal that on 8 July around 40% of the surface of the ice sheet had melted and just four days later that had increased to 97%.
The melt occurred as a strong ridge of warm air, called a heat dome, moved over Greenland. It was the latest in a string of heat domes during the last few months.
Some ice melting even occurred in the area where the ice is thickest, around Summit Station, in central Greenland, which is almost the highest area as it stands almost two miles above sea level.
The melt at Summit Point was so severe that it has been the worst at for more than 120 years, according to an analysis of ice cores by Kaitlin Keegan, of Dartmouth College, Hanover.
Glaciologist, Lora Koenig, a member of the Goddard Space Centre research team analysing the satellite data says melting events of this type occur every 150 years or so. However, if the trend continues, it will be very worrying."
NASA and the Indian Space Research Organisation agreed in March to share Oceansat-2 data.
"Ice cores from Summit show that melting events of this type occur about once every 150 years on average. With the last one happening in 1889, this event is right on time," says Lora Koenig, a Goddard glaciologist and a member of the research team analysing the satellite data. "But if we continue to observe melting events like this in upcoming years, it will be worrisome."


